Water management information system

Trace the water from well to network with Predixi WIS

Production, reservoirs, energy use and the network on one screen, from utility to district and from district to station. The water utility sets its priorities for action from the measurements.
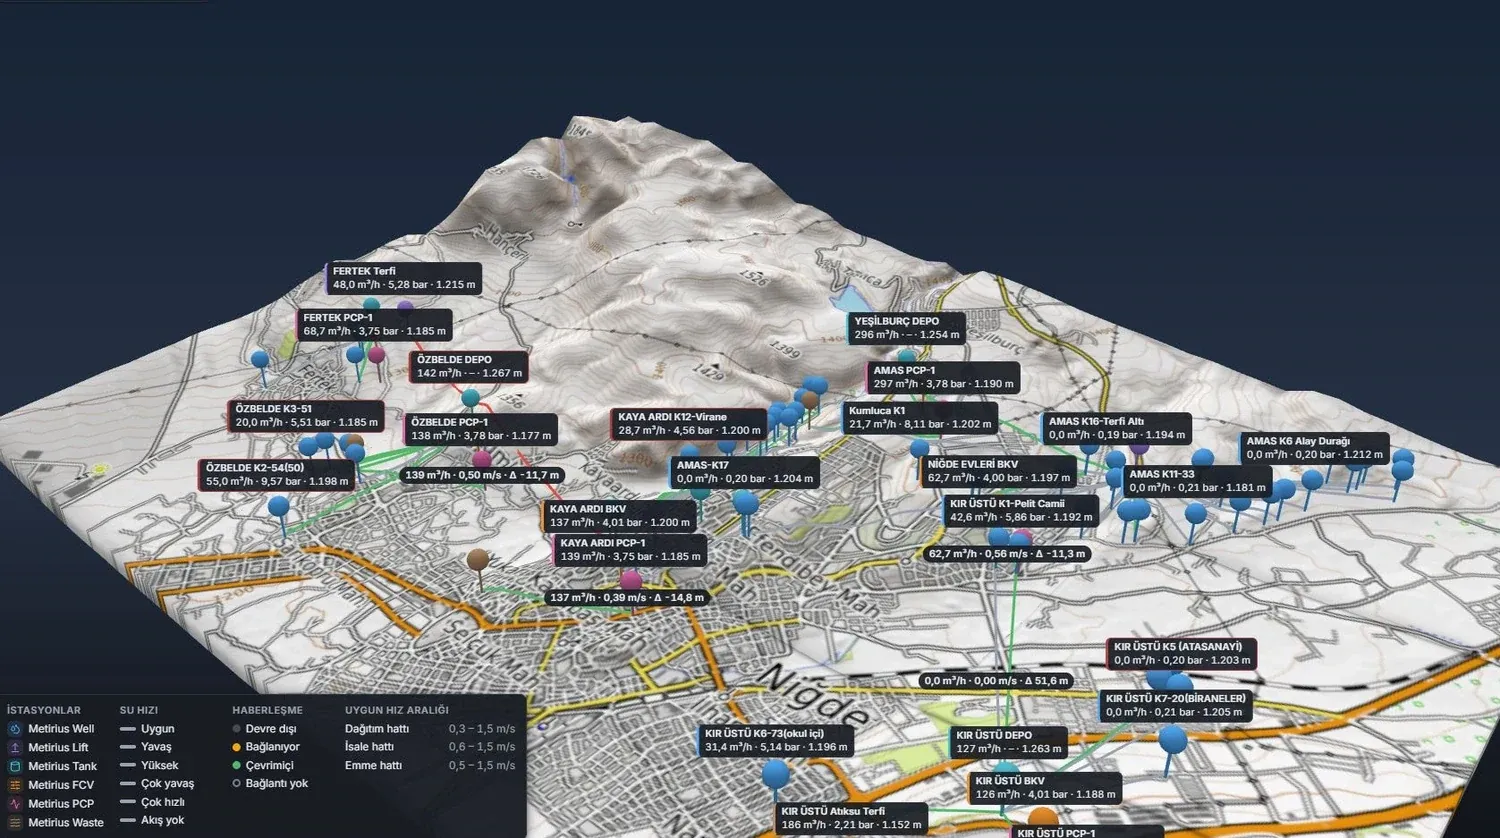
Predixi WIS 3D terrain view: wells, pumping stations and reservoirs on the map with reading labels
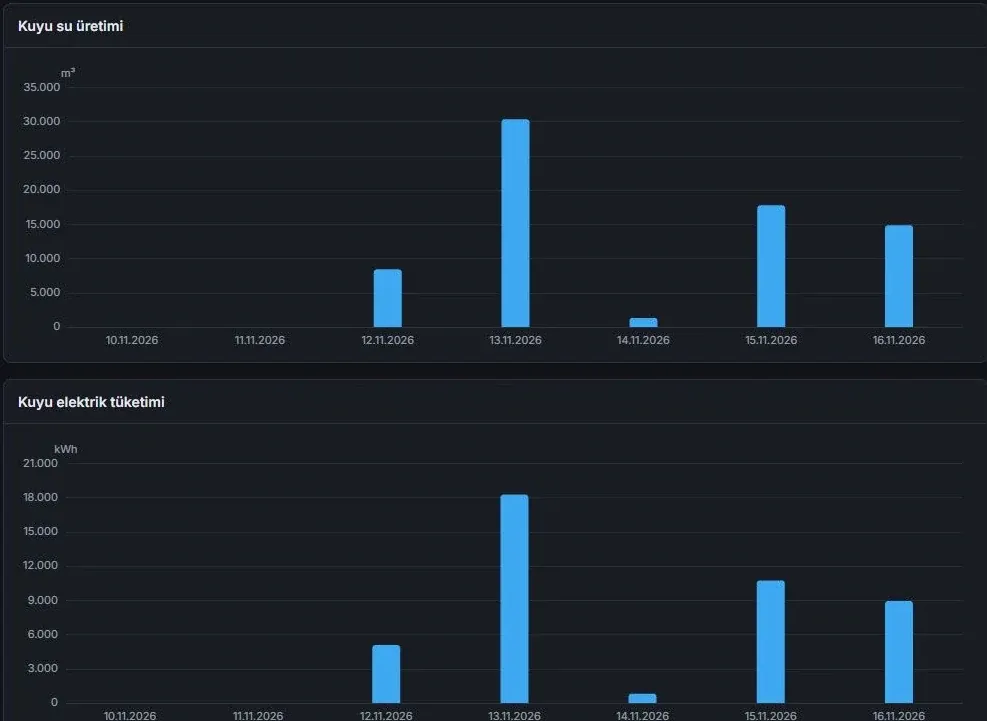
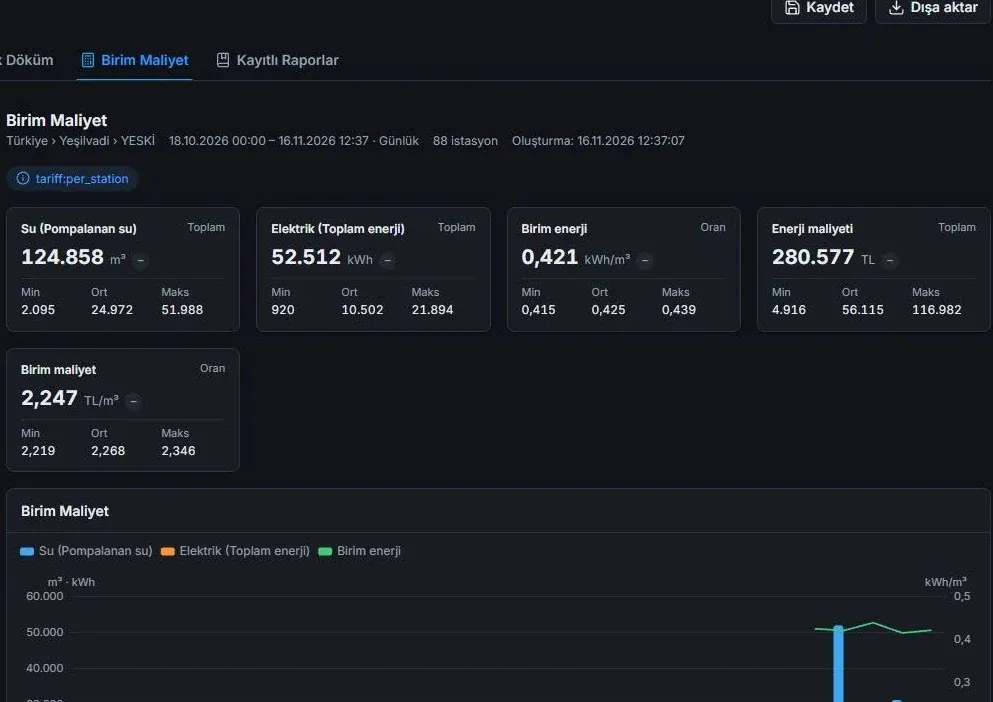
Unit cost report: water pumped, electricity consumption, kWh/m³ and cost per m³
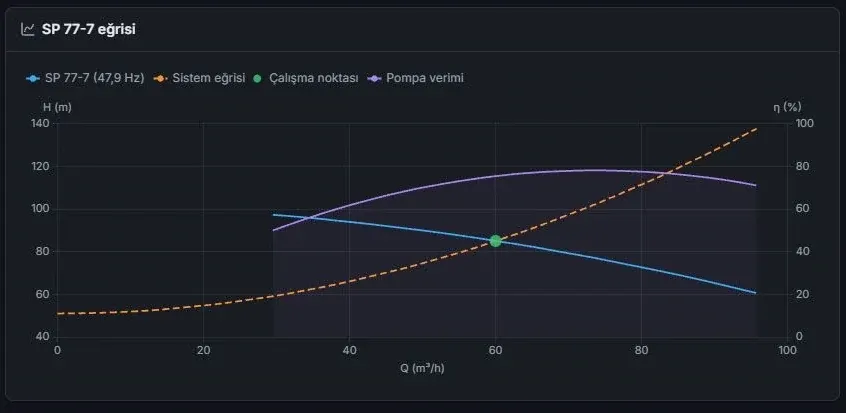
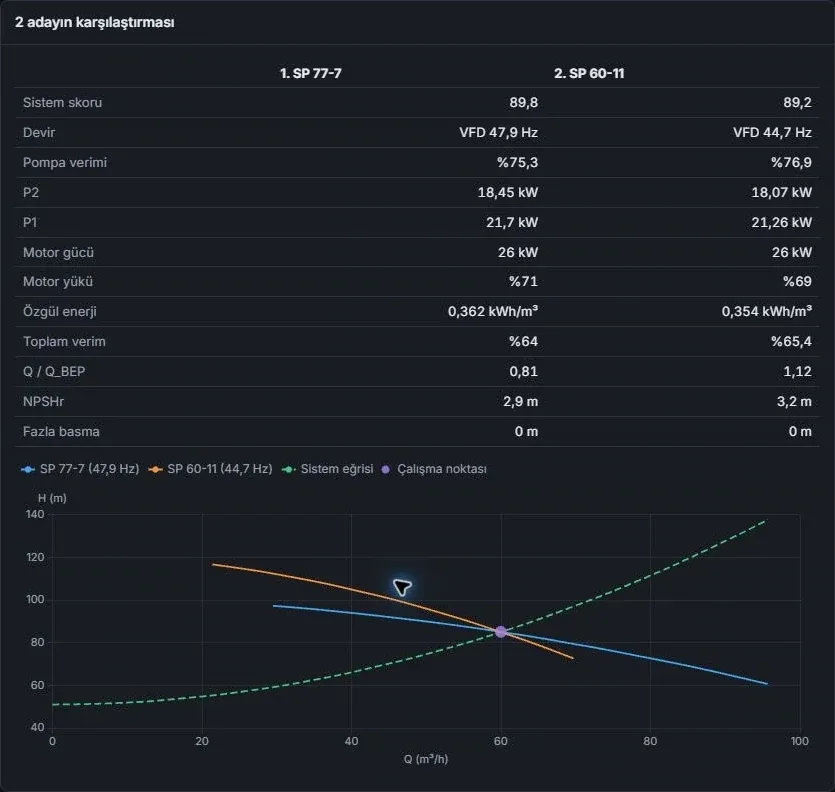
Operating point chart where the pump curve and the system curve intersect
tiers in the data model: utility, district and station; indicators filter by the selected utility, district or station
3
specific energy consumption, converted to cost per cubic metre with the configured electricity tariff
kWh/m³
questions answered by the reports: operations, energy, meters, pumps, alarms and maintenance
8
field drivers, plus a Simulator to test connections before going to site
11

The water’s route: from the well to the control room

Each step starts with a question operations ask. The screen answers it in the plant’s real layout.

  1. Well

    How does the well level change while the pump runs?

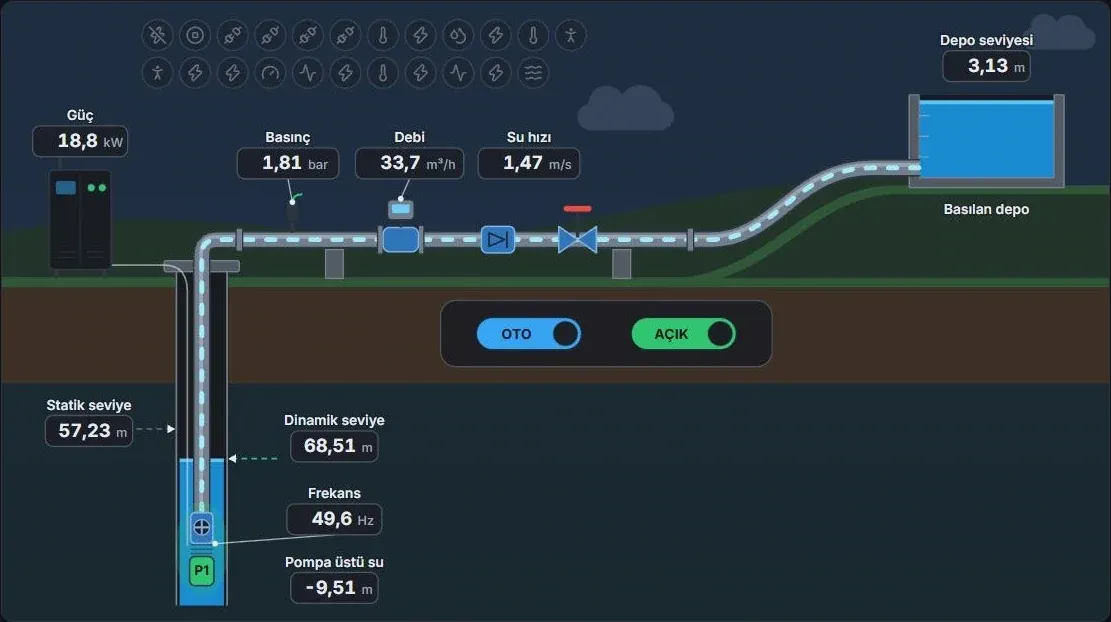
    Static and dynamic levels appear in the same cross-section as the submersible pump. Flow, line pressure and active power show how hard the pump is working.

    Explore the well screen(opens in a new tab)
    Well diagram: static and dynamic levels, submersible pump, flow, pressure and power readings
  2. Pumping station

    Which pump branches are carrying the water?

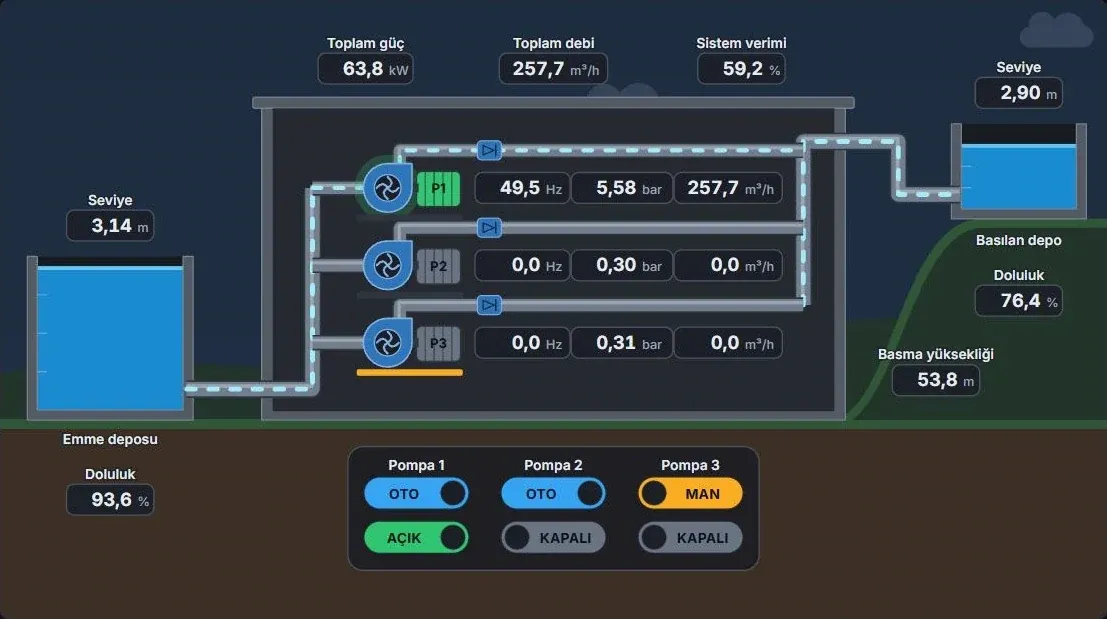
    Suction and discharge reservoirs and the pump branches share one diagram. Total flow and power show each running branch’s share of the load.

    Explore the pumping station screen(opens in a new tab)
    Pumping station diagram: three pump branches between the suction and discharge reservoirs, with frequency, pressure and flow
  3. Reservoir

    Is the water entering the reservoir keeping up with the water leaving it?

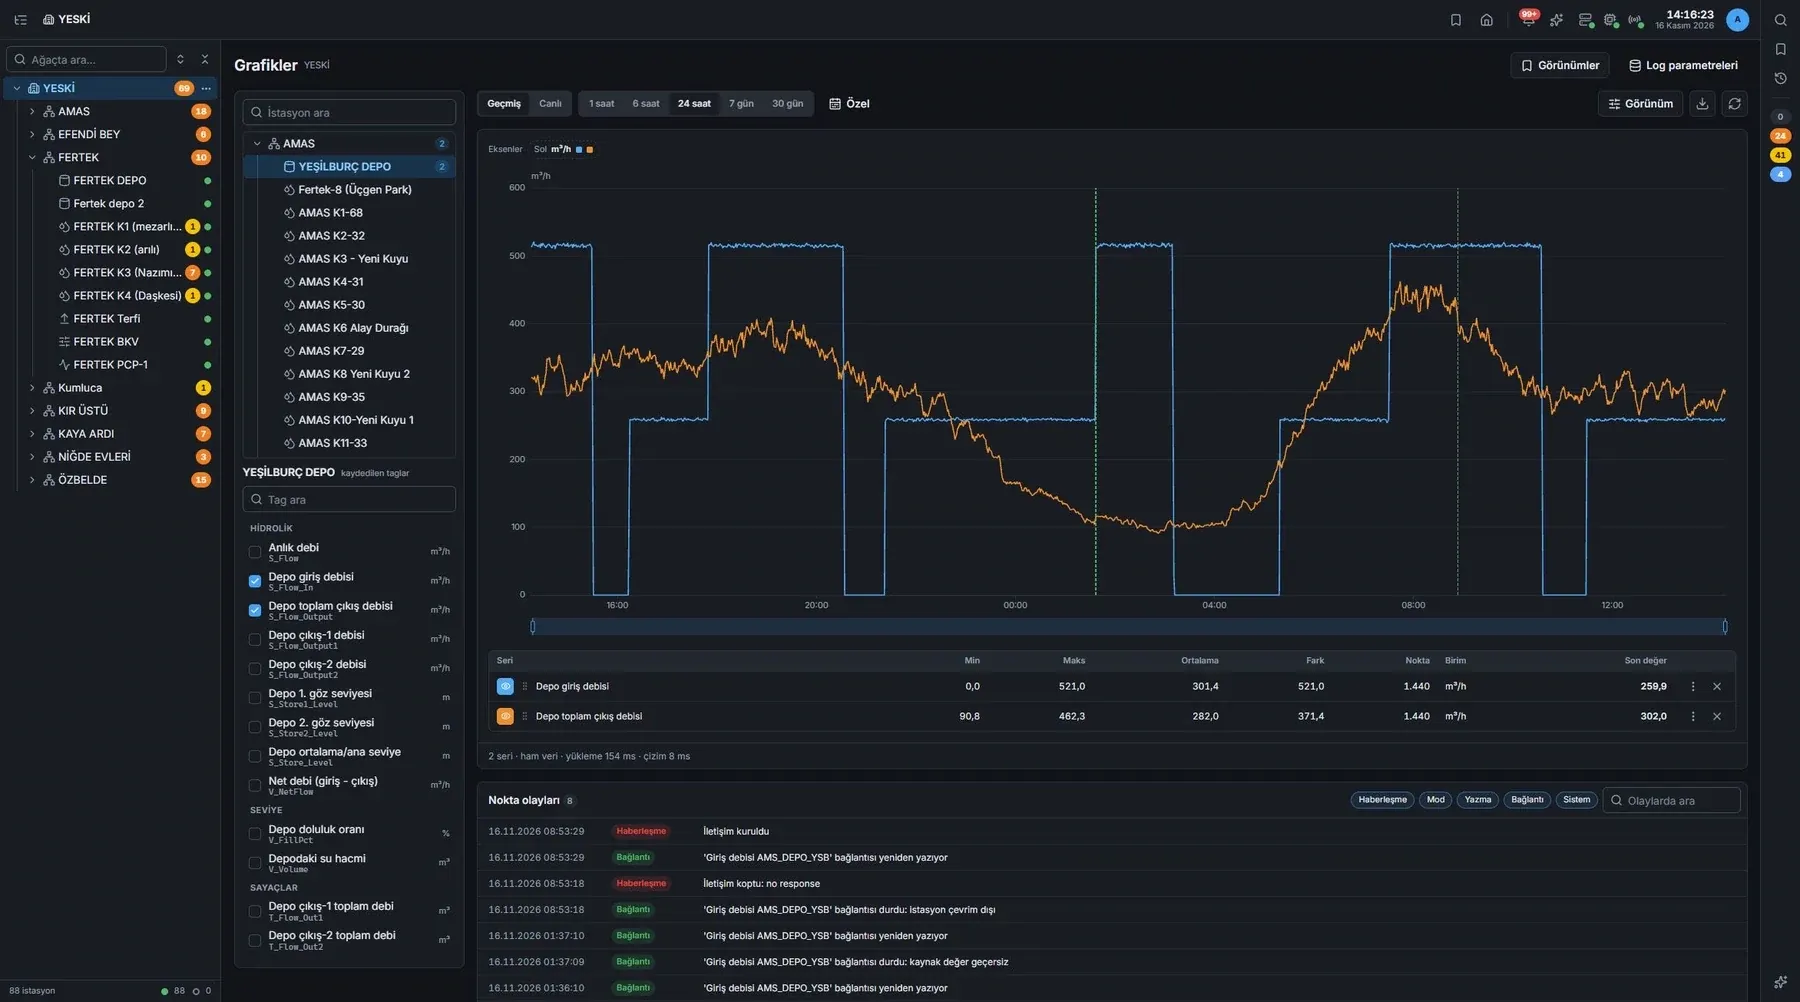
    24 hours of inflow and outflow are tracked on a shared axis. Check the event log for the hour when the curves diverge.

    Explore the reservoir chart(opens in a new tab)
    24-hour inflow and outflow chart for a reservoir, with an event list
  4. Distribution

    Which main is the water taking?

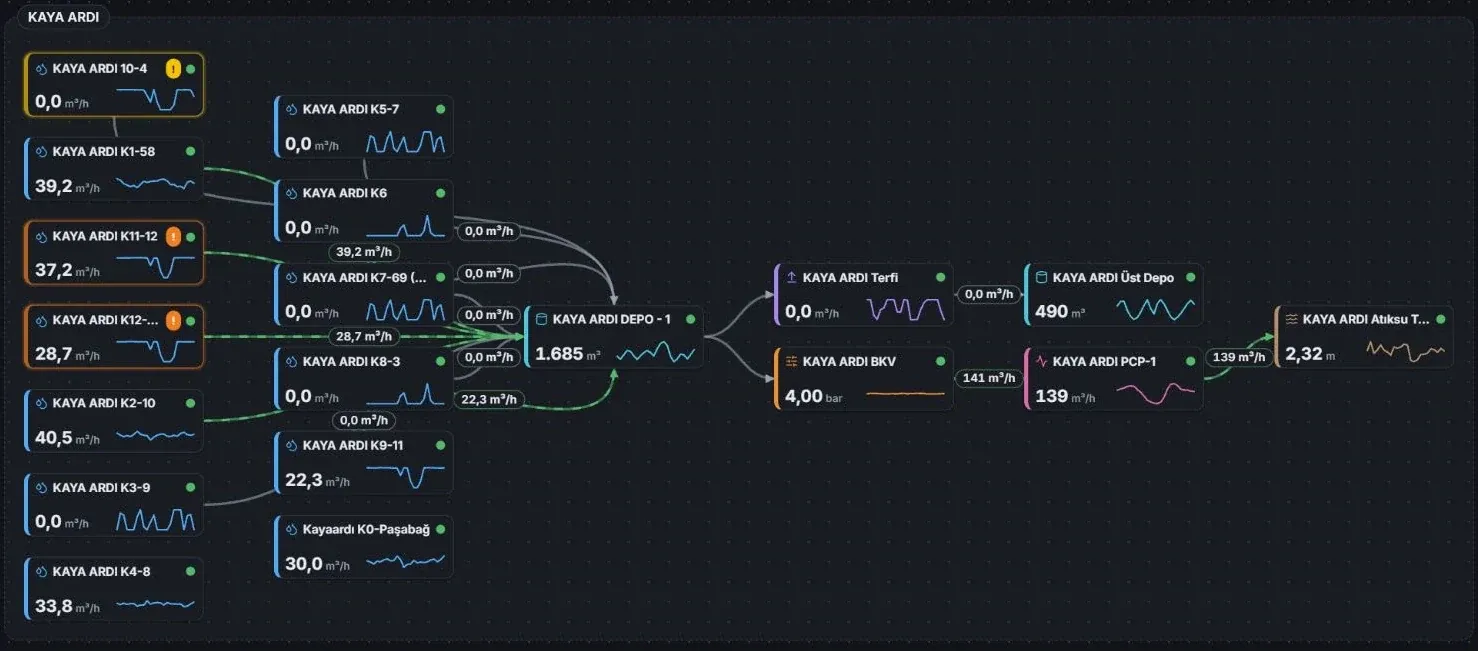
    Wells, reservoirs and distribution points connect in one diagram. Flow labels on the mains show the route the water takes.

    Explore the transmission diagram(opens in a new tab)
    Diagram of mains running from wells to reservoirs and distribution points, with flow labels
  5. Utility dashboard

    What changed across the utility today?

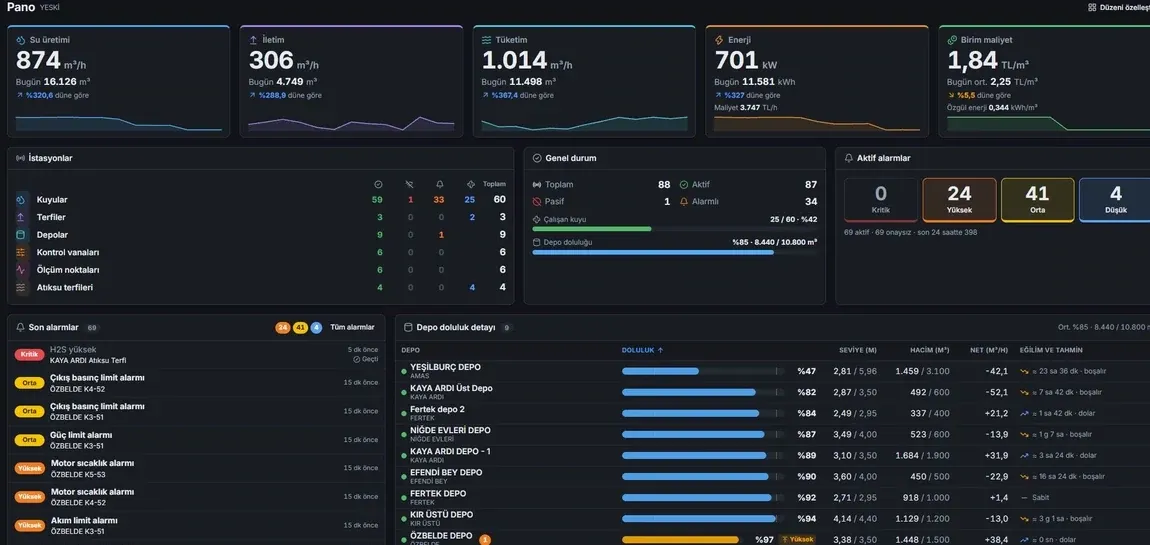
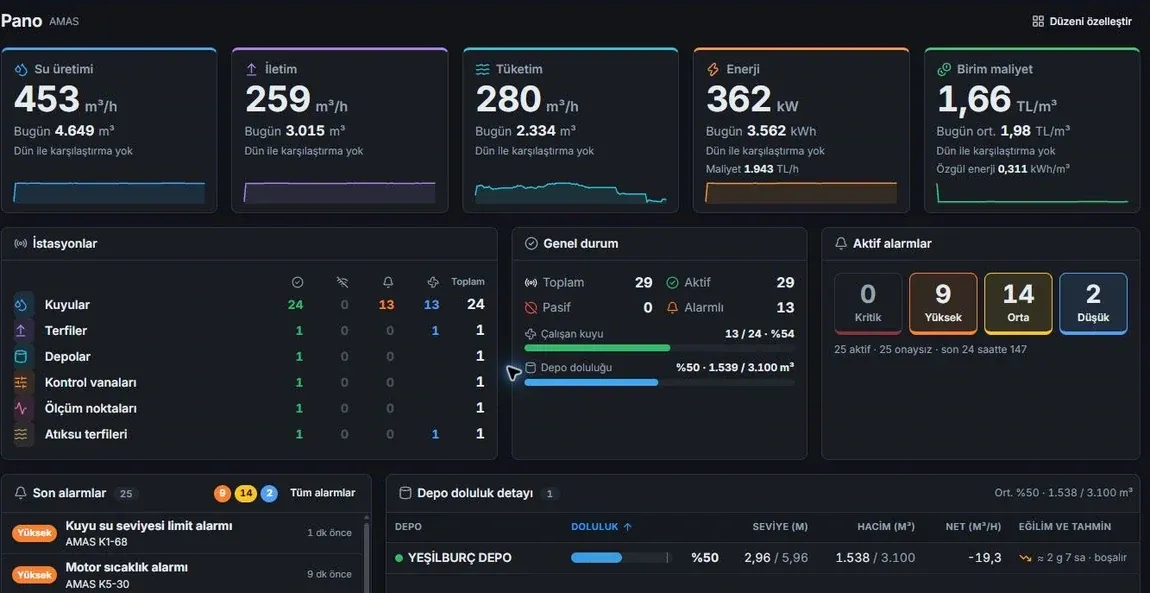
    Production, transmission, consumption, energy and unit cost sit at the top of the dashboard. Station, alarm and reservoir summaries lead to the source of a change.

    Explore the utility dashboard(opens in a new tab)
    Utility dashboard: water production, transmission, consumption, energy and unit cost indicators, with alarm and reservoir summaries
  6. Control room and field

    The control room and the field look at the same station

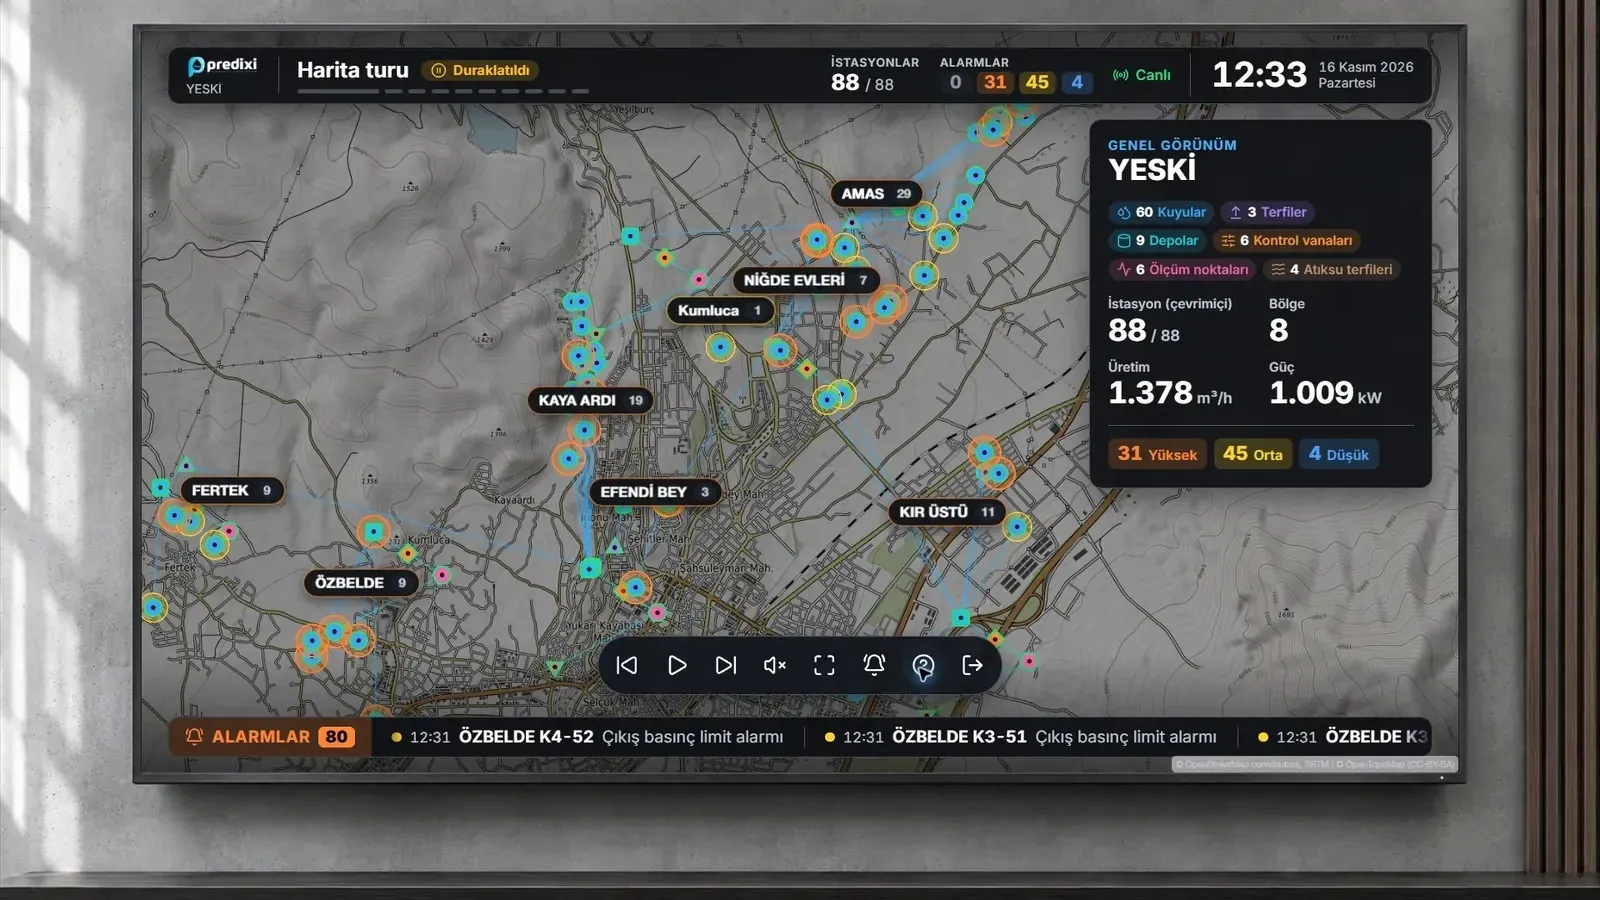
    The wall display puts stations on the map and energy use over the last 14 days on a chart; new alarms run along the bottom strip. Station cameras come together on one wall, and the field team follows reservoirs and alarms on their phones.

    Explore the control-room screens(opens in a new tab)
    Station map, active alarm counts and alarm strip on the control-room wall display
Well diagram: static and dynamic levels, submersible pump, flow, pressure and power readings
Pumping station diagram: three pump branches between the suction and discharge reservoirs, with frequency, pressure and flow
24-hour inflow and outflow chart for a reservoir, with an event list
Diagram of mains running from wells to reservoirs and distribution points, with flow labels
Utility dashboard: water production, transmission, consumption, energy and unit cost indicators, with alarm and reservoir summaries
Station map, active alarm counts and alarm strip on the control-room wall display

Every station in its own diagram

Wells, pumping stations and valves are not assessed with the same readings. Equipment, flow direction and readings are drawn to the plant’s real layout.

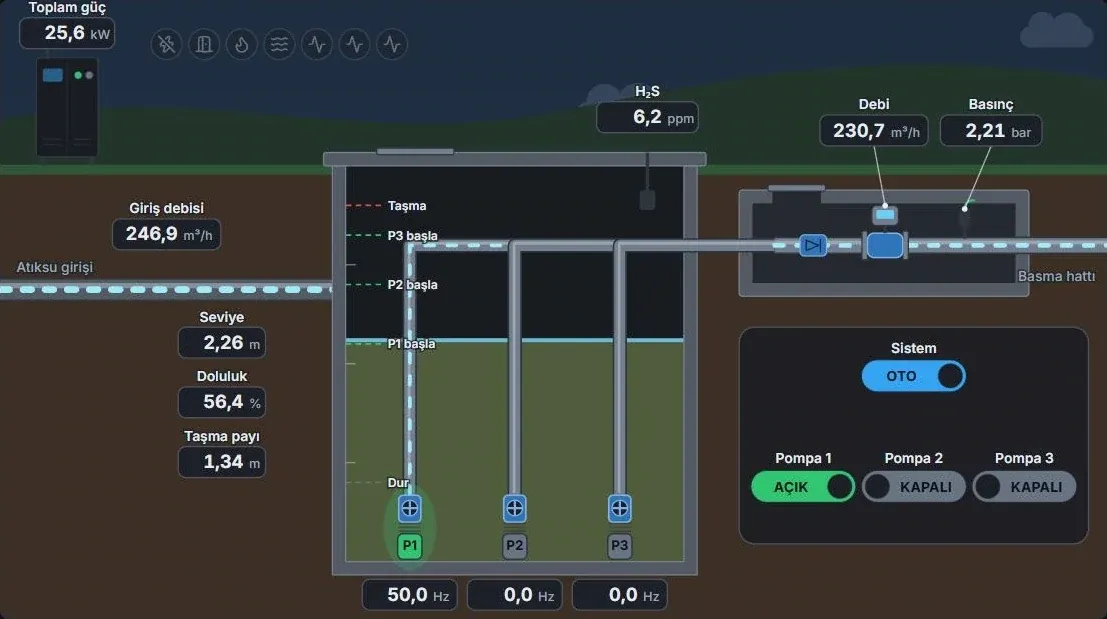
  • Wet well diagram of a wastewater lift station: level, fill, overflow headroom and H₂S

    Wastewater lift station · wet well

    How much headroom is there before the wet well overflows?

    Level, fill and remaining headroom appear together with pump states; the H₂S reading adds the hydrogen sulphide level on site.

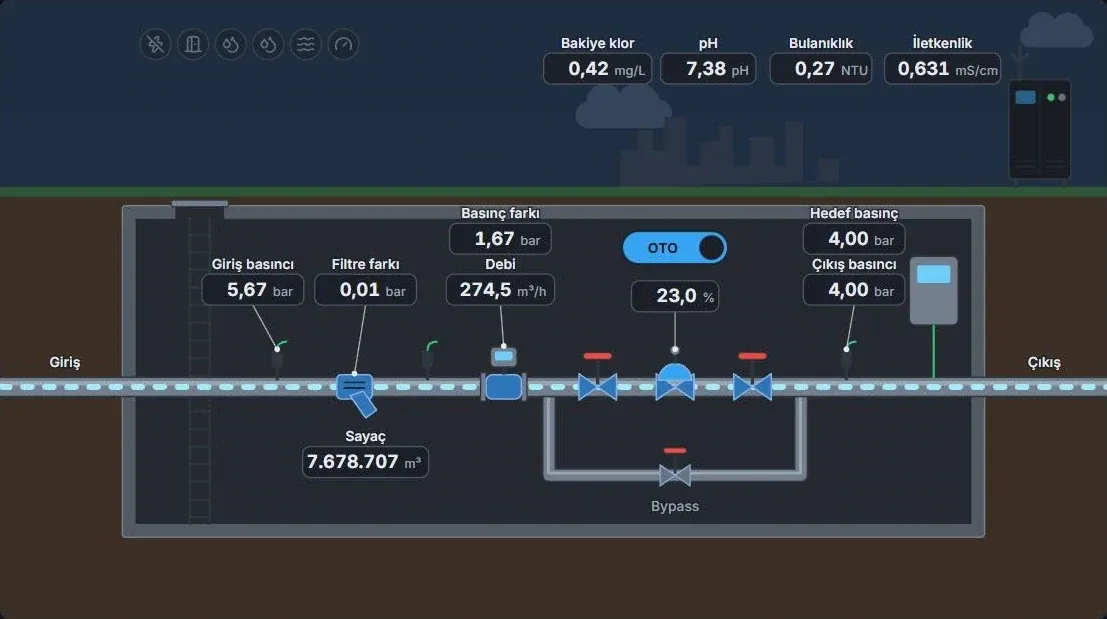
  • Control valve line diagram: valve position, flow, filter differential, inlet and outlet pressure

    Control valve

    How does valve position affect line pressure?

    Valve position, flow and filter differential pressure share one line diagram. Inlet and outlet pressure show the valve’s effect on the line.

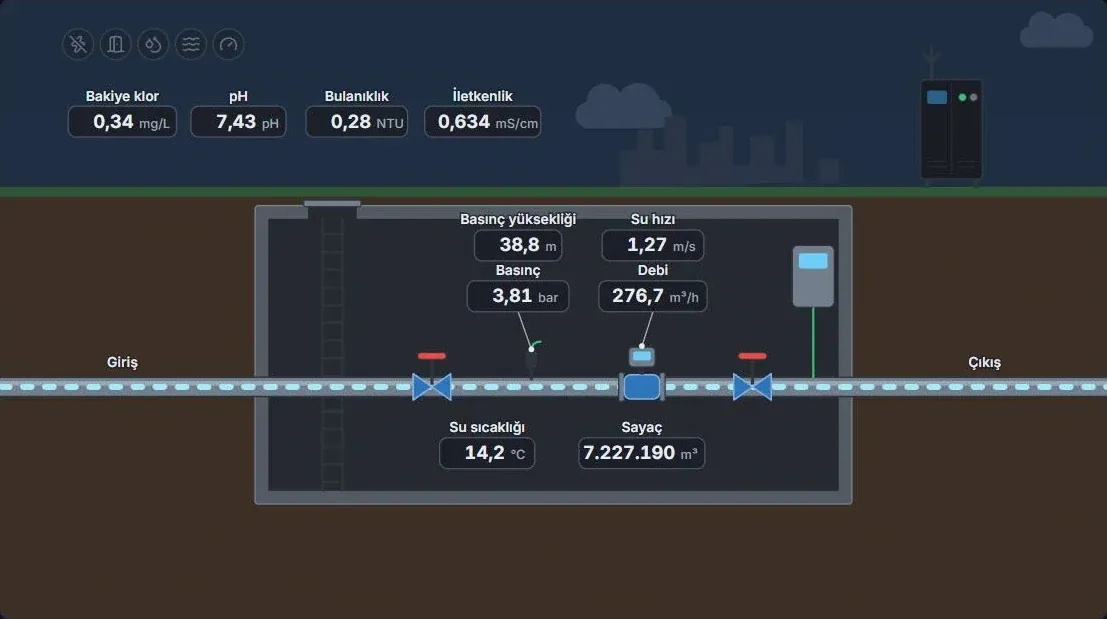
  • Pressure control point diagram: flow, pressure, meter, residual chlorine, pH, turbidity and conductivity

    Pressure control point (PCP)

    How are water quantity and quality changing together?

    Residual chlorine, pH, turbidity and conductivity are read next to flow, pressure and the meter total.

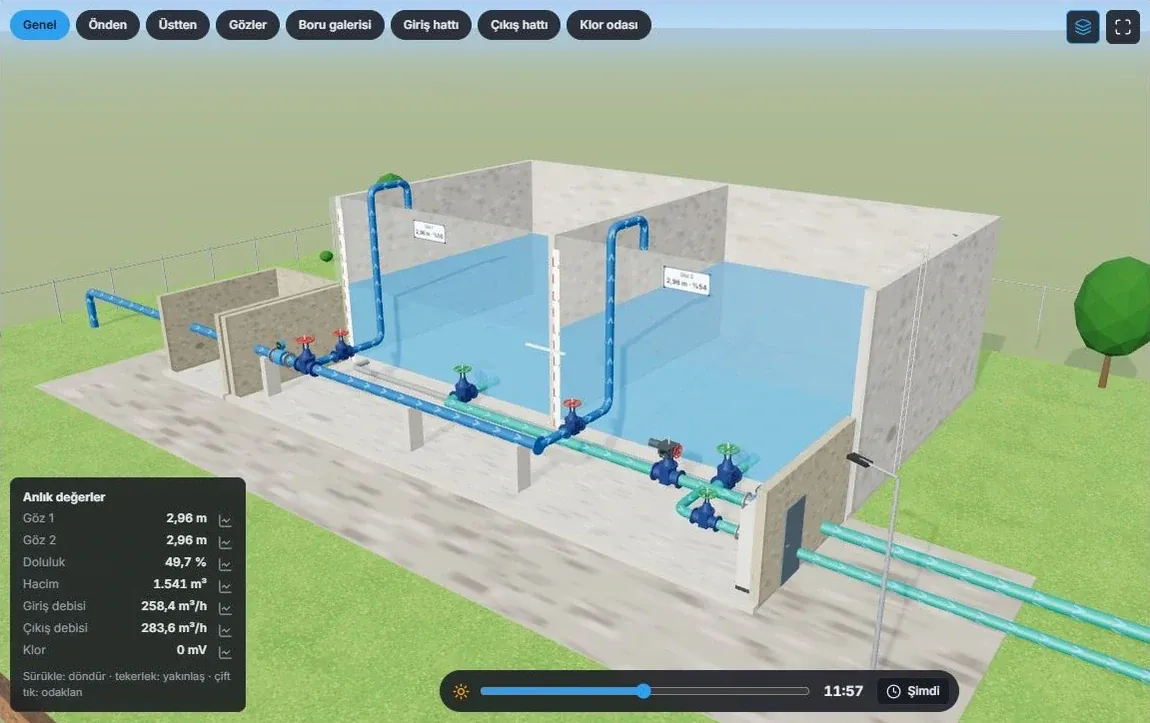
  • Three-dimensional cutaway of a reservoir: compartments, pipe gallery and live values

    Reservoir · 3D model

    Which part of the plant does a reading belong to?

    The cutaway shows the reservoir compartments and the pipe gallery. Level, volume and flow are read on the matching part of the model.

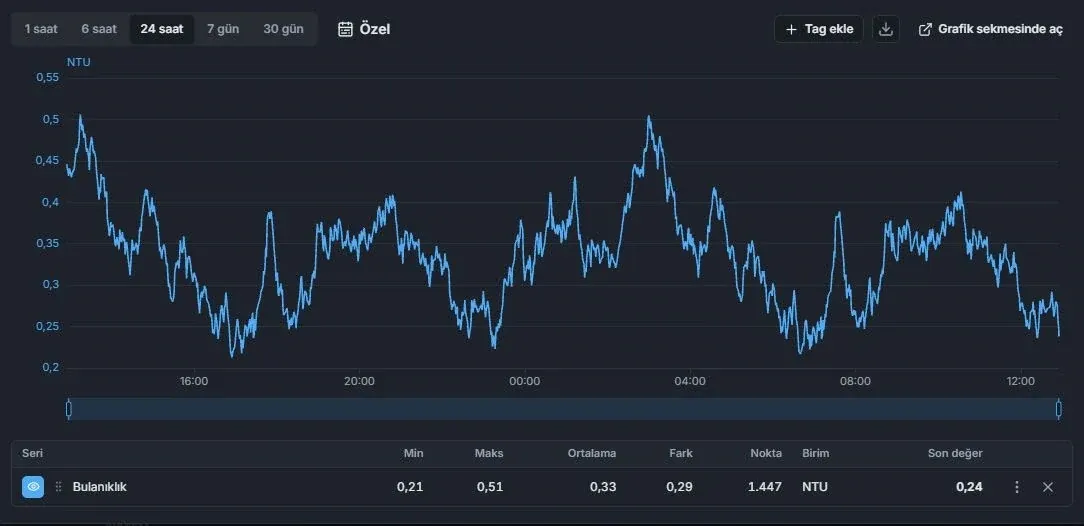
  • 24-hour turbidity chart and period summary

    Water quality history

    When did the change in water quality begin?

    The turbidity trend and period summary show whether a rise was brief or lasting.

  • District dashboard: production, transmission, consumption and power indicators for one district

    District dashboard

    Is the change confined to one district?

    Select a district to narrow production, transmission, consumption and power to its stations. A local difference hidden in the utility total becomes visible.

Every report answers a question

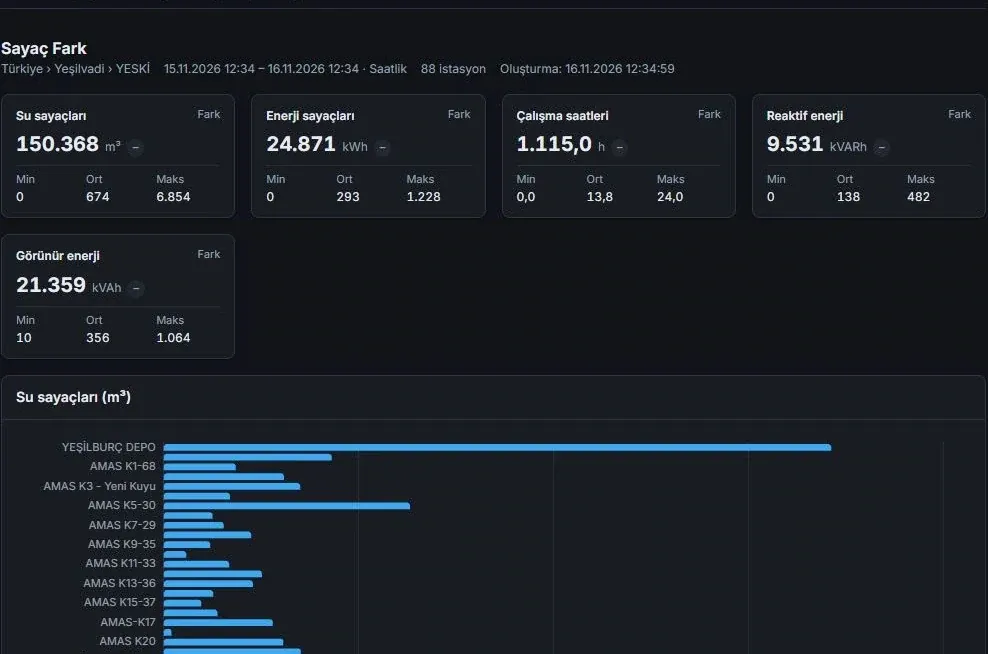
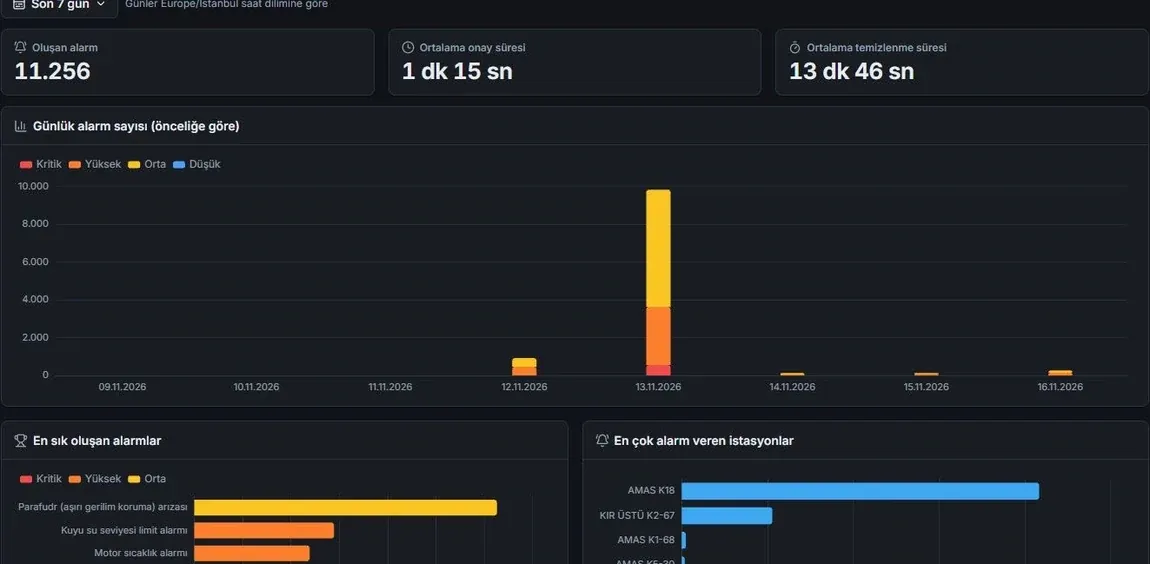
Production, energy, pump and maintenance data are read over the same period and scope. The energy and pump reports show where efficiency is being lost.

From alarm to maintenance job

A recurring fault is not forgotten: the alarm reaches the right person, becomes a maintenance suggestion and stays on the board until the job is closed.

  1. 01

    The alarm reaches the right person

    Alarm rules and station permissions determine who receives which notification: in-app, email, SMS and mobile notification. Minimum priority and quiet-hour exceptions can be defined; delivery history filters by date and channel.

  2. 02

    A recurring alarm becomes a maintenance suggestion

    The station, count and date range of a recurring alarm are shown together. A maintenance record opens directly from the answer to “Which station should be serviced first?”

  3. 03

    The job board shows open work

    Maintenance and fault records sit in columns by status; scheduled tasks and due dates are tracked. Downtime and repair durations are reported, so the team sees what recurs and what takes longest.

From the field to the utility’s data systems

PLC drivers collect readings in the field. Utility applications use the same data through the REST API and MCP.

Field data sources

  • Well, pumping station, reservoir and valve PLCs
  • Metirius field control devices
  • Simulator for testing

Predixi WIS

Utility, district and station data in one model.

  • Control room and field

    Wall display, web app and mobile view on the phone.

  • The utility’s GIS

    The REST API serves geolocated stations, network topology and pipelines.

  • AI applications

    Live readings, history, meters, alarms and the pump catalogue through MCP; access scoped per tool.

  • Configuration backup

    Point and device definitions, settings, alarm rules and permissions can be restored to an empty database; time series are protected separately.

  • ModbusTCP/IP, RTU and ASCII
  • Siemens S7TCP/IP
  • OMRONFINS and NJ Ethernet
  • MQTTClient
  • DNP3Ethernet client
  • IEC 60870-5-104Client
  • IEC 61850 MMSClient
  • OPC UAClient
  • SimulatorLocal test driver

Predixi Intelligence says which data an answer rests on

Specify a district, station and period in your question. The answer gives the key findings together with the period the readings cover; totals are calculated from the hours with recorded readings.

Your utility can choose a locally hosted AI model or an external provider. The sample conversation uses demo data from the product presentation.

Explore Predixi Intelligence(opens in a new tab)
Operator

How much water did the district produce in the last 7 days?

Scope: District · last 7 days

Metrics: 3

Assistant

Production over the last 7 days was 29,407 m³. Well electricity consumption was 16,538 kWh, and specific energy consumption 0.562 kWh/m³. Totals are calculated from the hours with recorded readings.

On the web today, in the stores soon

Predixi WIS runs in the browser and in a mobile view on phones. Apps for iOS, Android, macOS, Windows and Linux are in preparation.

  • Web app

    Sign in to your utility from the browser: dashboard, stations, reports, maintenance and Predixi Intelligence. Authorised users monitor stations, follow alarms and update supported field control settings remotely; notifications are sent according to station permissions.

    wis.predixi.com/ui
  • Mobile view

    At the plant, field teams check the reservoir level and alarms filtered by their district on their phones.

  • iOSApp StoreComing soon
  • AndroidGoogle PlayComing soon
  • macOSMac App StoreComing soon
  • WindowsMicrosoft StoreComing soon
  • LinuxLinuxComing soon

Predixi IO and Predixi WIS compared

Both products share the same field-driver layer and MCP-based AI access; they do different jobs.

Predixi IOPredixi WIS
What it isIndustrial SCADA platformWater management information system
Built forSCADA engineers and operators of any processWater utilities: management, operations, field and maintenance teams
Core jobDesign HMI screens, bind live signals, run alarms and automationTrace water from well to network and decide where to act
Data modelProject, screens and tagsUtility, district and station
AnalyticsTrends, hourly values, period statistics, alarm reportskWh/m³, cost per m³, meter differences, pump operating point, maintenance priority
NorthboundOPC UA server, REST, Data Bridge, MCP, remote accessREST API (stations, topology and pipes for GIS), MCP
Choose it whenYou want to build a SCADA system for your own process, or carry PLC data into an existing SCADA or ERP systemYou run a water network and need production, energy, cost and maintenance decisions across the utility

Planning to use both together? Tell us about your system.

Which site needs attention today?

Priority goes to the district where supply or service is at risk: does production meet consumption, which plant is nearing its capacity limit, which critical fault is still open? Talk your network through with us.